Top 10 Metrics Every Campground Owner Should Monitor
If you want to fill more sites, improve guest satisfaction, and get more return from your marketing dollars, you need to track the right data. These metrics every campground owner should monitor aren’t just numbers on a screen—they’re insights into what’s working, what’s not, and where you can grow. Especially during high-traffic times like opening weekend or holiday events, understanding your data gives you a competitive edge.
If you are new to analytics and understanding the basics and have not yet read our posts from earlier this month, go back and read those here:
Below are the top 10 metrics every campground owner should monitor, with real-world examples and best practices tailored to the outdoor hospitality industry.
1. Website Traffic (and Sources)
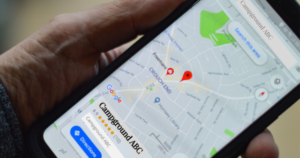
Your website is your digital campground. It is the first experience that most of your campers are going to have with your business, well before they step foot on the soil of your amazing park. This means, you are going to want to track website metrics regularly so you understand not only how many people are coming to your site, but who they are and where they are coming from. This will better help you improve the experience on your site and invest in the digital marketing tactics that are actually working for your business model.
Track: Users, sessions, traffic source (organic, direct, referral, paid)
- Why it matters: This tells you where potential guests are finding you.
- Try this: Compare your site traffic from Opening Weekend 2024 vs. Opening Weekend 2023 to gauge marketing success. You can easily do this by toggling your dashboard by date.
- ✅ Tool to use: Google Analytics or Looker Studio dashboards
2. Conversion Rate
Tracking conversions for the outdoor hospitality industry is a metric every campground should monitor because it literally tells you how many people are actually completing the task that I am asking or expecting them to. This could mean booking campsites on your reservation link, it could mean signing up for your monthly newsletter, it could mean completing a review of your campground post-stay, or signing up for an activity or onsite event.
Track: Form fills, online bookings, newsletter signups
- Why it matters: High traffic means nothing if no one books.
- Try this: Measure your Easter weekend promotion clicks vs. actual reservations.
- ✅ Best practice: Use clear CTAs on your site and retarget with email if guests don’t complete bookings.
- ✅ Tool to use: Google Tag Manager + Google Analytics 4
Use GTM to set up conversion tags for actions like:
-
-
-
- Booking engine clicks
- Form submissions
- “Call Now” button taps on mobile
- Newsletter sign-ups
- Downloads (e.g., site maps, events calendar)
-
-
This allows you to define what counts as a conversion beyond just pageviews—and send those events to GA4 or even Google Ads for optimization.
3. Cost Per Booking
Cost per booking is a really important metric that every campground owner should track, because you need to know if you are still in the green or in the red when getting new campers (or repeat) campers to book. This could mean short term reservation systems or annual campers that stay for longer periods of time. Basically this metric tells you, the effort it took my business to book this one customer is X, and the amount of money they are paying to camp here is Y, so what is my final revenue share, Z. If you are not tracking this, its possible that you are spending more money long-term on booking new campers than you are on their stays. Now, this is definitely a metric that you are going to want to track for a long time, especially if you are just starting out. We all know that you have to spend money up front to bring in new business. So, ensuring you are monitoring this over time is really important.
For instance, you could spend $100 to bring in customer J as a new camper. They only spend $90 on their campsite. However, when they get there, they end up purchasing things from your store, pay for activities, and decide to rebook for next year before they leave. Their revenue is much higher than that $90 long-term, and is now in your retention pool to get to come back each year. You would argue that the $100 it took to recruit them is well worth the squeeze at the end of the day.
Track: Ad spend vs. successful reservations
- Why it matters: Helps determine how efficient your marketing is.
- Try this: Run a paid ad campaign for Mother’s Day weekend and track how much it cost to acquire each booking.
- ✅ Tool to use: Google Ads + booking data from your reservation system (make sure you can look at their total spend through your system and not just the reservation cost long-term).
4. Booking Window
It’s important to know your typical booking window. We have clients, for instance, that allow their campers to book for the next year before they even leave their site at check out in the current year. This means for the most of their bookings are happening in person, a year in advance. That is a completely different customer journey and experience that you would want to build out for than, say, a campground that is mostly holiday and weekend stays, combined with some full-timers.
You will want to understand this cadence and approach it accordingly based on your park’s business model.
Track: Time between booking and arrival
- Why it matters: Informs when to launch your marketing campaigns.
- Try this: Are guests booking 3 months out, or 3 days out for Memorial Day? Adjust your promotions accordingly.
- ✅ Pro tip: Promote early bird discounts to extend the booking window.
5. Occupancy Rate
Occupancy rate is SO important. We believe so much in it, and that it is a metric that every campground owner should monitor. We created the Vacant Transient Site Calculator so you could see the dollars that are being left on the table by your unbooked sites. Plug in the number of weeks per year that your campground is open for business, along with the average weekly rate per transient site, and the average number of sites that you have, and bam. Your cost of your empty sites is right there in front of you. Since this is money LITERALLY left at the campfire, it is a key one that you want to make sure you understand and have as a clear goal for everyone on staff.
Track: % of sites booked over a specific time
- Why it matters: Reveals demand patterns and pricing opportunities.
- Try this: Compare occupancy during events like 4th of July or local festivals to plan future promotions.
- ✅ Tool to use: PMS (property management system)
6. Email Metrics
While open rates are getting trickier and tricker to track thanks to major changes in email operating systems like Apple that skew results, it is still important to make sure that number isn’t zero. So, we still watch open rate, but we are especially interested in click through rates (how many people click on your links in your email), how many people are unsubscribing to your communications, and how many of your emails are bouncing.
If you are sending a lot of emails, and you notice that most people are unsubscribing, you might decide to do some A/B testing to make sure it’s not your messaging first. If that does not change, you would then want to reflect upon who is actually on your email list. If it is not campers, and is instead, say, vendors or local businesses and your emails are all “book now!” you are going to want to make some changes to your audience. Similarly, if your emails have a really high bounce rate, this means you need to do some clean up on your database and remove the bad emails. If you do not, this can damage your sender reputation over the long run and impact your ability to get in front of the people you need to, when you need to.
Track: Open rate %, click-through rate (CTR), unsubscribe rate, email bounce rate
- Why it matters: Measures how effective your email marketing is.
- Try this: Send an Easter recap with photos and measure how many clicks your photo gallery or “book your next stay” CTA gets.
- ✅ Best practice: Segment your list (RVers, tent campers, families, etc.)
- Best tools: You have heard it from us before, but Hubspot is the best system we have found for reliable tracking, bot sorting, and reliable reporting on emails (and so much more).
7. Guest Reviews & Ratings
This is an easy one to understand, but a harder one to deliver on. Guest reviews and ratings are a metric that campground owners should monitor for the obvious reason. You want to know how your guests are experiencing your campground and if there are any glaring changes that need to be made to improve that guest experience. Additionally, more and more new campers are going to be turning to trusted review sources like Google and TripAdvisor to read reviews on your campground or RV park before they decide to book. If it is empty and there is no feedback, or, worse, if it is filled with negative reviews, they are likely to not choose to book with you. Conversely, if you consistently receive glowing reviews, they will be more likely to book now.
We have a great article on how to manage reviews here.
Track: Google, TripAdvisor, Facebook reviews
- Why it matters: Directly impacts new guest decisions and SEO.
- Try this: Monitor reviews after high-traffic weekends to spot trends (great hosts? Wi-Fi complaints?)
- ✅ Best practice: Set up alerts and respond to all reviews promptly.
8. Social Media Engagement
If you have not already, you can set up a Meta Business Suite account to manage your social media profiles like Instagram and Facebook all in one place. Here, they can give you insights into how your posts are performing, including engagement statistics like the ones below. This will help inform you what is working, and what to post about in the future based on past results. If you are posting on a wider-range of platforms, there are some great free tools out there that have expanded posting and metrics reach like Metricool.
Track: Likes, shares, comments, saves, link clicks
- Why it matters: Measures brand awareness and guest connection.
- Try this: Post an Opening Weekend carousel or reel—then track how many comments and shares it gets.
- ✅ Tool to use: Meta Business Suite or Instagram Insights
9. Repeat Guest Rate
Also known as “retention” in the marketing world, repeat guest rate is an important metric for campground owners to monitor because it will tell you about guest experience, and help you build out your budget for expected revenue in the future. It will also help you tailor your marketing communications to these individuals differently than, for example, someone that has never booked with you before.
Track: % of guests who book more than once
- Why it matters: Loyal campers cost less to retain and often become advocates.
- Try this: Offer a discount code to returning guests and track redemptions.
- ✅ Best practice: Use tags in your reservation system to track re-bookings.
10. Revenue Per Available Site (RevPAS)
This can be easier or trickier depending on how you charge for your sites, but it could also inform you if a more nimble dynamic pricing strategy is appropriate for your park based on holiday weekends, estimated long-term sites, repeat customers, and more.
Track: Total revenue ÷ total available campsites
- Why it matters: Gives a holistic view of your profitability, factoring in both occupancy and pricing.
- Try this: Compare RevPAS across summer weekends to identify revenue opportunities.
- ✅ Advanced tip: Bundle services like firewood or kayaks to boost per-site income.
Why These Metrics Matter Now
As the camping season kicks off, these are metrics every campground owner should monitor—especially around high-impact weekends like Easter, Opening Weekend, and Memorial Day. Tracking these not only helps you improve this year, but sets you up for even better success next year.
Need Help Making Sense of the Numbers?
At Martrek Digital, we don’t just talk metrics—we live them. As campers and marketers, we know what it takes to fill your campground and maximize every marketing dollar. If you’re ready to make smarter, data-driven decisions, let’s chat.
👉 Book a Free Strategy Session and take control of your campground’s future.